Tools for the system administrator.
The user got an option to install one of three default skins for the web interface without the need to purchase a personal design. In other words, if you have three different websites, you can set up three different skins for them without getting a personal design.
On the Status tab, we added the option of viewing the size of the compressed messages (if the database compression is activated), network and network traffic speed. For ease of analysis, the chart interval can be selected from 2 hours to 2 years.
Now the administration system interface expands on the screens with higher resolution (1,600 width and more). It will help get rid of the relocation of elements to new lines as well as show data more efficiently.
Now the free space in the disks and directories vital for Wialon Local operation can be controlled with the help of email notifications.
Added the ability to schedule the update for the certain time and day of the week.
We developed the mechanism for the mass background export/import of unit messages: now you can select all units or a part of the units (by account, user), launch the message export (for the entire time if necessary) and thus make their backup.
Then the old messages can be deleted from the system reducing the history. Later, if you need to view the old messages, you can launch the mass background import of the saved messages. The mechanism works in the background without overloading the system showing the status and progress.
Added the ability to upload logos for the authorization page and the monitoring system interface in the .svg format (for better display on the HD screens).
Now the backup server installation can be performed from the Wialon Local ISO image: when entering the contract number and password, you can select a Local or a backup server mode.
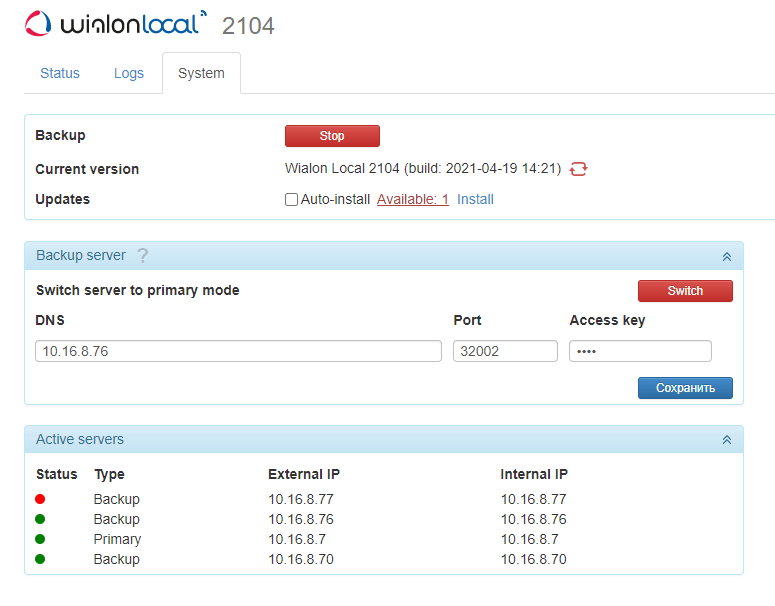
Backup service got its own administration system to manage and show all the important data and switch to the Local (major) mode. In the major administration system, there’s also an option of switching to the backup mode. Besides, there’s an option to save and restore the Local configuration (additional customization files, logos, and certificates).
Now you can change the password to the administration system yourself.
Certificates are now renewed beforehand and fast as the renewal happens not in the cycle but recursively, which means that the renewal of the next certificate starts only after the renewal of the previous certificate finishes.
In the Port column in the Hardware type section, you can change the port for the hardware type if for some reason the default port doesn’t suit.
For the partners’ clients working by the White Label model, you can remove the word ‘wialon’ from sdk queries.
Added the ability to set up the email dispatch for the administrator to get only those that are important. On top of that, in the what’s new emails you will have the short summary of the upcoming update.
We updated the list of available retranslators. Now it also includes:
Accounts, resources, billing plans, users, units, retranslators, and ACL management system.
We added a separate column to display the number of activated units in the CMS on the Accounts tab. A separate column displaying the number of active units helps calculate their cost at the end of the month, simplifies the analysis of the number of active and deactivated units, and reporting on them.
The new Activated units service provides billing only for active units, excluding deactivated ones. To enable this functionality, a user should specify the cost in the new service and remove this cost from the Units service.
Units list management and quick access to major monitoring options.
In new reports by geofence and groups of geofences, we added:
All of this will help make reports even more informative and user-friendly.
In group reports by units, we added the ability to mark the selected trip interval with a red line and center the map on it when turning on the display of all the ride tracks or messages on the map. The interval can be viewed in the Trips, Engine hours, Rides, Speedings tables for the report by unit groups, and in the Rides table for the report by driver.
To register the order confirmation or rejection, we have added a dedicated column – Confirmation/rejection time. Now users exactly know the time of confirmation or rejection instead of constantly being aware of any change in the status of the order.
In the Orders report by unit, group of units, driver, group of drivers, we added the column showing the actual time when the courier entered the order geofence. It will help distinguish the confirmation of the fulfilled order and visiting the order geofence. Now the dispatcher will see if the courier confirmed the order fulfillment before even entering the needed geofence.
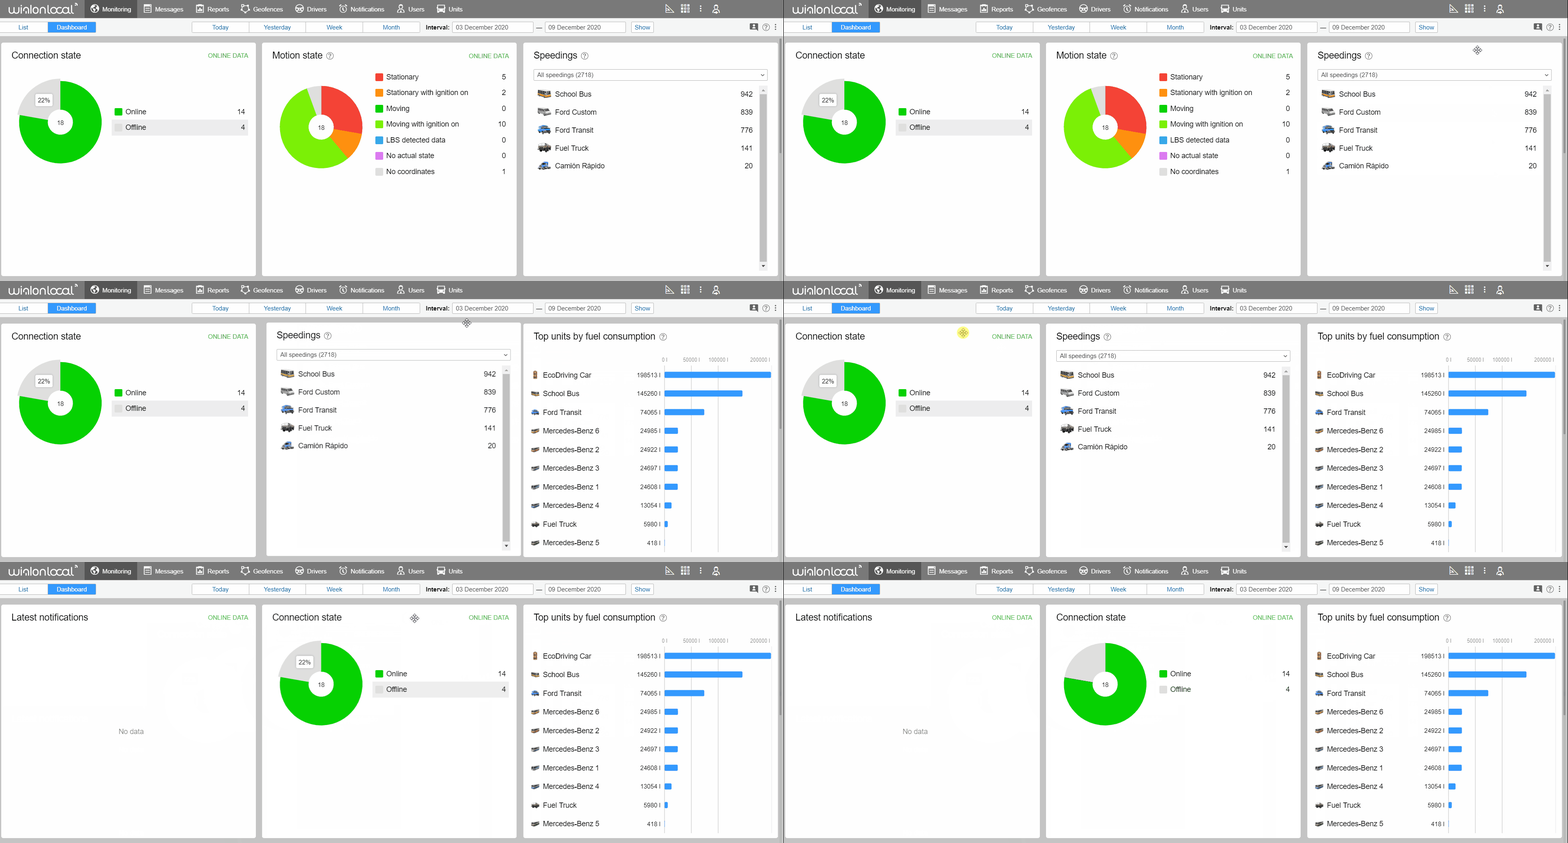
The Dashboard is a separate powerful tool with useful functionality, so now it is placed as a separate tab in the horizontal menu and no longer opens automatically. The Monitoring tab remains in the same place.
The data in the Dashboard is displayed only for the units that have been added to the work list.
We added the opportunity to set the time period for data display on the Dashboard. You can also choose one of the available default intervals: today, yesterday, week, month.
The Mileage and Consumed by FLS blocks of the Dashboard have the new type of data display. We have replaced the column charts with line charts, where each unit has its line color. We have also increased the number of displayed units from 5 to 10.
We added two new blocks on the Dashboard tab – Top units by fuel consumption and Top units by mileage. The first block displays units from the Monitoring tab with the maximum fuel consumption by FLS for the specified period. The second block displays units from the Monitoring tab with the maximum mileage for the specified period.
We modified the management of the blocks’ order on the Dashboard page. Now, hovering over the block title, users can drag any block to any place. Thus, managing the blocks’ order on the Dashboard page has become genuinely user-friendly.
We have delivered two new map styles, and both are vector ones.
Apart from the fancy appearance, the new vector styles are more technologically advanced. They load faster and allow adding new useful features in the future.
We added the geocoding, reverse geocoding, and routing support.
Now, after creating a geofence from the interface, it is displayed on the map by default. And there is no need to spend time manually enabling each created geofence. Please note that the imported geofences are not rendered by default.
Previously, geofences were rendered randomly, and it was impossible to assign their display order if they overlapped. Sometimes, a small geofence might not be visible if it was displayed below a larger geofence.
Now the display sorting is as follows: large geofences of a circle type and geofences of a polygon type are located below smaller geofences; geofences of a line type are always higher than other geofences. It allows escaping the unwanted geofence overlapping and ensures the visibility of each of them.
Our users often employ the calculator to determine the duration of different time intervals. Previously the result of such a calculation was provided in seconds. We have added a converter that allows producing the result in a user-friendly format: hours:minutes:seconds, as well as in the date and time format.
The following constants have been added to the calculator:
Due to this, users will be able to calculate various metrics or formulas with regard to the report execution interval more flexibly.
Earlier, when working with formulas in the calculator, users faced the following problem: when editing an existing formula, the not-so-big cell size became even smaller. In the current update, we have added more space for the formula, and the whole formula is visible now.
For special machinery that has several fuel tanks or engines, we relocated the fuel consumption settings to the fuel sensors settings. Now everything is located in a single window (the settings of the needed fuel sensor).
Additional info. Within the framework of this task, we also added the ability to bind sensors to sensors (engine sensors to FLS, engine efficiency sensors to the selected engine sensors); extended the fuel consumption calculation by math for FLS and сhanged the import and export process both for sensors and entire units, so that you could, for example, import the previously exported units correctly. Also, we added new fuel consumption columns to some tables for more complete information on the unit or unit group.
We changed the general look of the sensor properties list. Firstly, we corrected the field order. Secondly, in the window, there are only those settings where you can input data right away. We removed the fields that appear after activation of other settings.
In Locator, we have the option of centering the map on the selected units. Previously, it was turned on by default after reloading the page. Not all users found it useful because they had to turn it off all the time when reloading the page multiple times (non-stable internet connection, viewing from the mobile device).
Now, you have to do it just once – when reloading the page, this Locator setting will retain.
Starting 2021, major browsers stopped supporting Flash Player that provided the video playback in Wialon. In this respect, we developed a special video service for Wialon Local to view live streams by units in the modern format without using Flash Player.
We added the option of opening photos via external links. Previously, this option was available for video only. If we receive data not directly from the device, but from the manufacturer’s server, we often get it in the form of links and not files themselves. To view them, we needed this enhancement. It is essential for Wialon integration with third-party video platforms.
To simplify the process of granting access and cut the time needed to perform it, we added the new filtration criteria on the Access tab: unit properties, groups of units, users, accounts, resources, and groups.
Now, the items can be filtered by the creator, the account name, the group name, resource, unit ID, and so on. We also added the tooltips to help users work with the updated filtering options.
In order to make the interface more user-friendly, we have changed the layout of some blocks:
We have added a new search criterion in the dashboard – a phone number. For example, it has now become more convenient to search for specific vehicles if you analyze traffic consumption by units and want to find a unit by the SIM card phone number installed in its tracker.
We released an enhancement for counters. Now, the relative sensors' values (relative odometer, relative engine hours) can be used from the previous message. It means that if the mileage and/or engine hours counter is set to a relative sensor, then the values from the previous message can be used in the parameters.
The relative sensors' data can be used not only in reports but also for mileage/engine hours counters set to relative sensors thanks to the update. This, in turn, guarantees the correct operation of the maintenance.
Previously, the ignition sensor's Timeout value was not considered when calculating the events in the Wialon app for Android and iOS. It could lead to the data difference in reports in the system’s web-version and a mobile app. Now, this value is considered, and data is consistent.
We added the filtration by geofences in the Images table. The new feature will come in handy when the user needs to download photos for a specific period by each client (if the client is marked on the map as a geofence). Thus, you can view the needed information in the most convenient way.
We added the ability to filter the list of elements by new criteria: group, account (resource), unique ID, etc. Also, added a drop-down list with search criteria: now a user chooses which parameter to apply.
We got back the dynamic search feature. Now when creating a sensor, the system will highlight the most suitable parameter in the course of entering the parameter without waiting for the full match. The dynamic search works for any parameter in the filter, not just the first one.
We carefully analyzed all the unit type names that our users entered and created a universal library. Now the user does not need to invent anything: in the general unit settings, they select the right unit type from our list. If the selected unit is a vehicle – the user goes further and selects the right vehicle type in the Profile tab. These types will be displayed in the unit properties window, used as a filter in the CMS and in the worklist, applied for generating reports, and added as a new parameter in the calculator.
The data that the user has already entered manually will not be lost – it will be transferred to the Note field.
Previously, Wialon Local users could log in to their accounts only using Wialon login and password. Now, for the monitoring website, you can activate the authorization via Google account. To do so, you need to turn on the corresponding option in the administration system and then in the monitoring system on the Security tab of user properties bind your Google account. On the authorization page, you will see the Log in with Google link. Clicking on it, you’ll log in to Wialon with the selected account.
Delivery management solution.
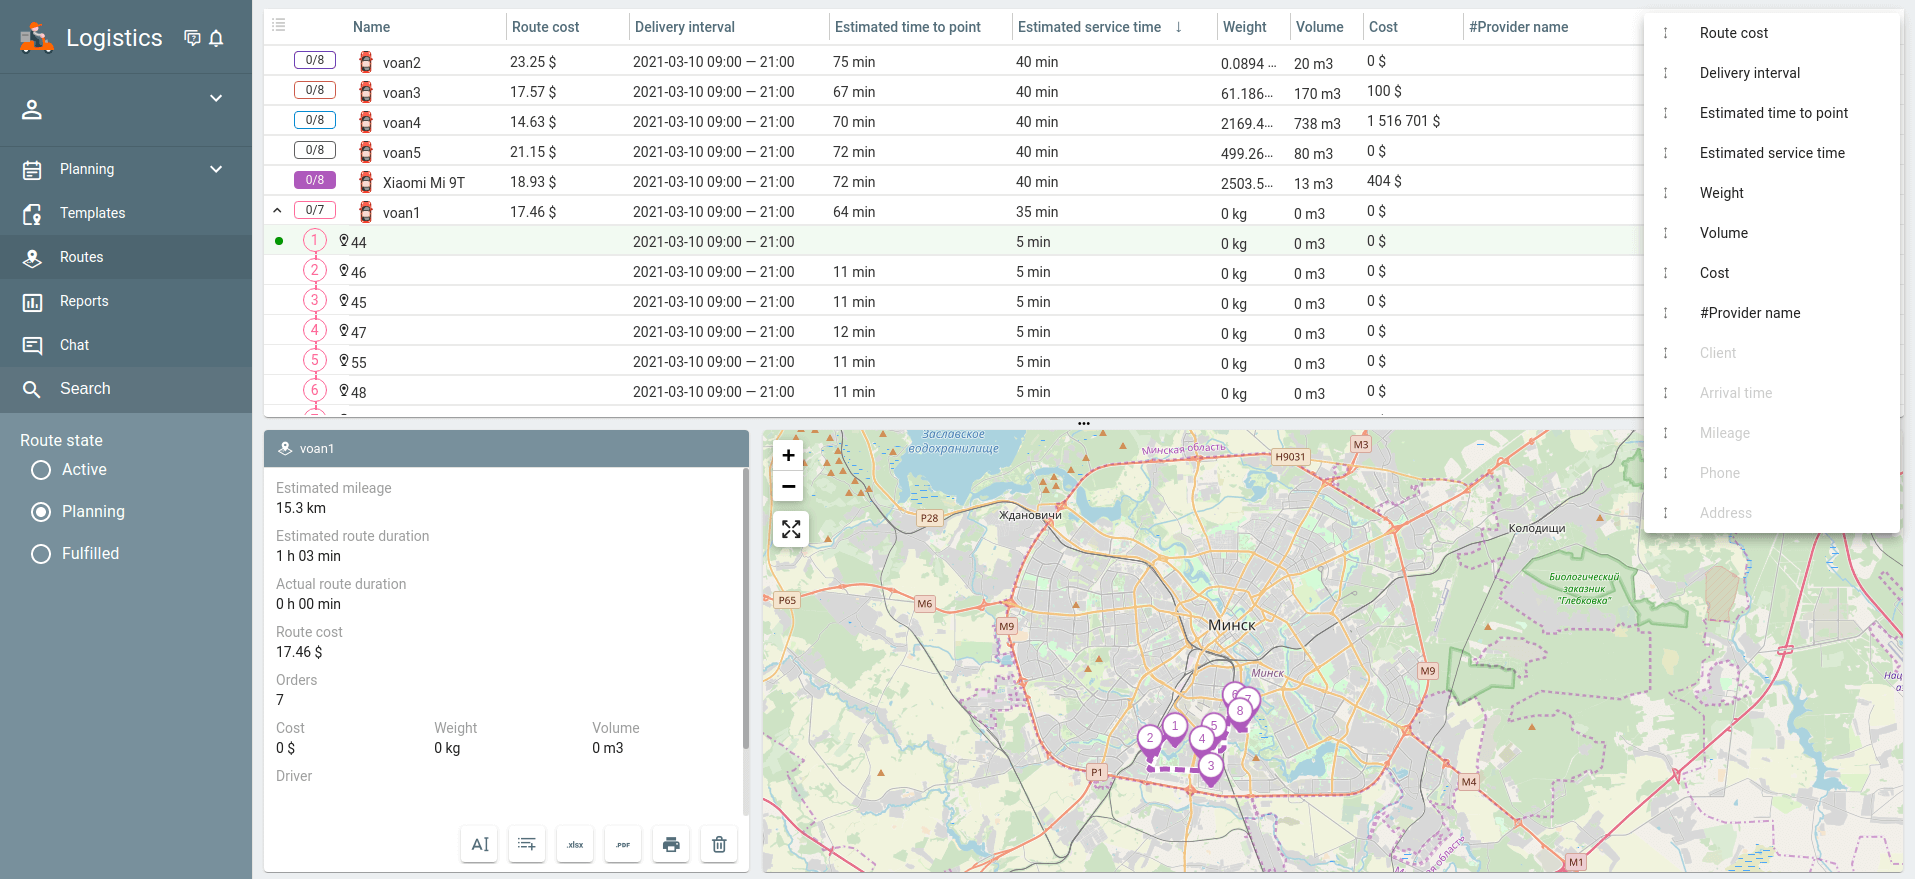
We added the ability to calculate the total route cost. It is displayed on the third step of planning and on the Routes tab.
In the app settings on the Planning tab, there’s a new block where you can specify the cost for the order key parameters: cost per 1 kilometer, 1 hour, 1 order, and vehicle departure. If several methods are selected, the calculation results are summed up. The received data will help calculate the cost-effectiveness allowing to plan routes at a lower cost.
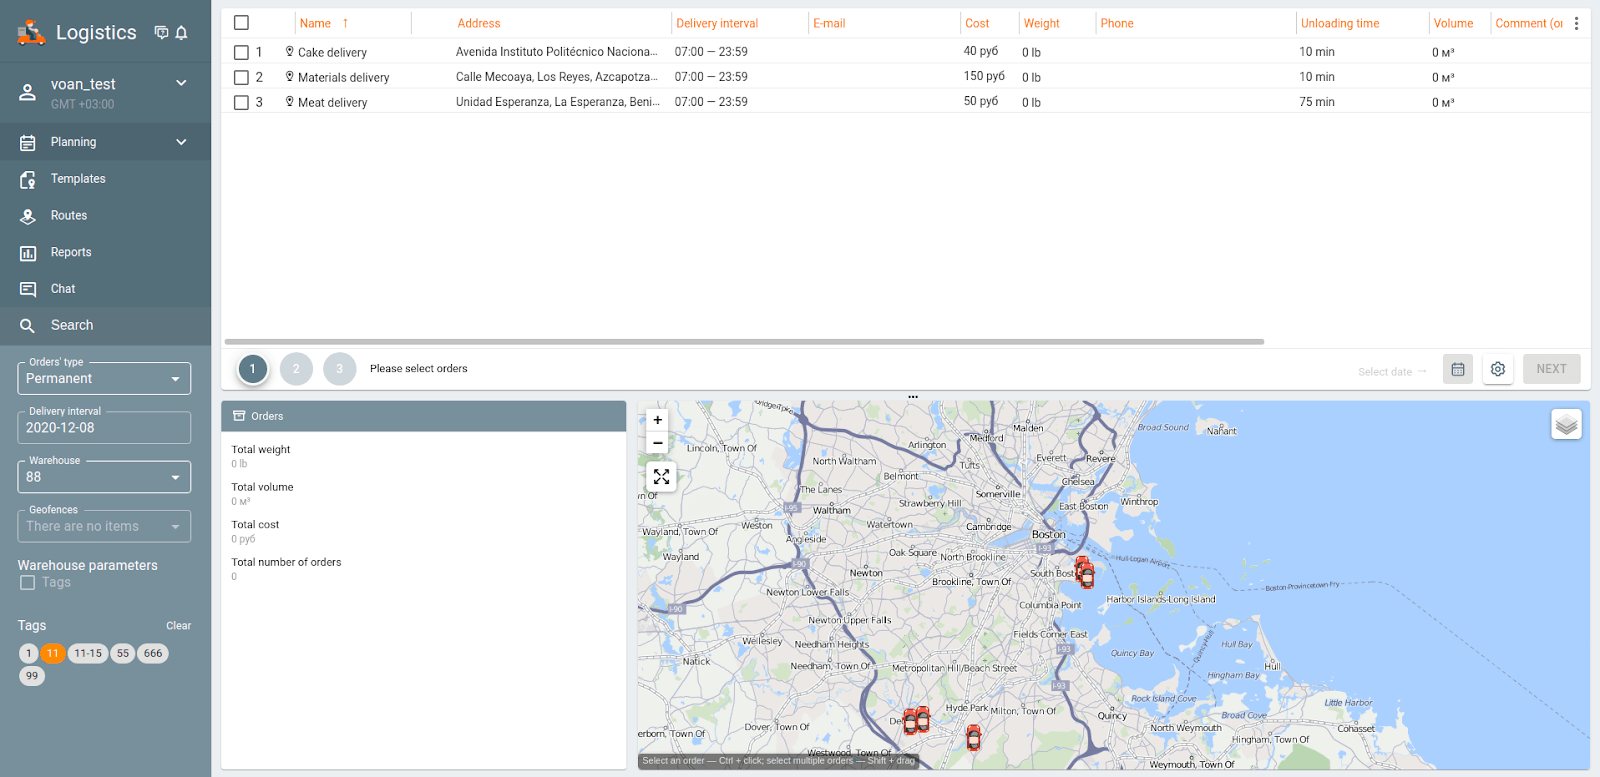
We added several new columns to the routes table: Delivery interval, Estimated time to point, Estimated service time, Weight, Volume, Cost. The info from custom fields is also displayed in corresponding columns. It allows getting even more helpful data when planning the routes. All the columns are available for export and printing.
We completely redid the Logistics documentation and made it more clear and user-friendly. You can find the updated version in the Wialon Help Center.
Previously, to start working with a chat in the Logistics app for Android, users had to give multiple permissions both in the app itself and in the system. Now the messages display in the chat doesn’t need any additional actions while the chat is updated every 10 seconds.
In the Logistics app for Android, we added the option to attach several files with signatures to the order (previously, you could attach only one file). In some cases, such as medicine delivery, for example, there’s a need to attach at least two different signatures.
We added the ability to change the address format in the Address field for the source of address information Gurtam. The address format will be the same as in Wialon Local settings.
The following options appeared in the settings in the report navigation panel:
Now, if the driver has not visited the order (the unit is to send a message at zero speed within the order delivery radius), then the data in specific columns ("Deviation", "Actual mileage", "Actual time to point", "Fuel consumed", columns with temperature) will not be displayed. Thus, the events on the order will be reflected most accurately.
With no “fulfillment time” concept in use, we have specified the visit and the confirmation/rejection of orders. And now the order that the driver actually visited is considered as the visited one. Thus, statistics has become more user-friendly.
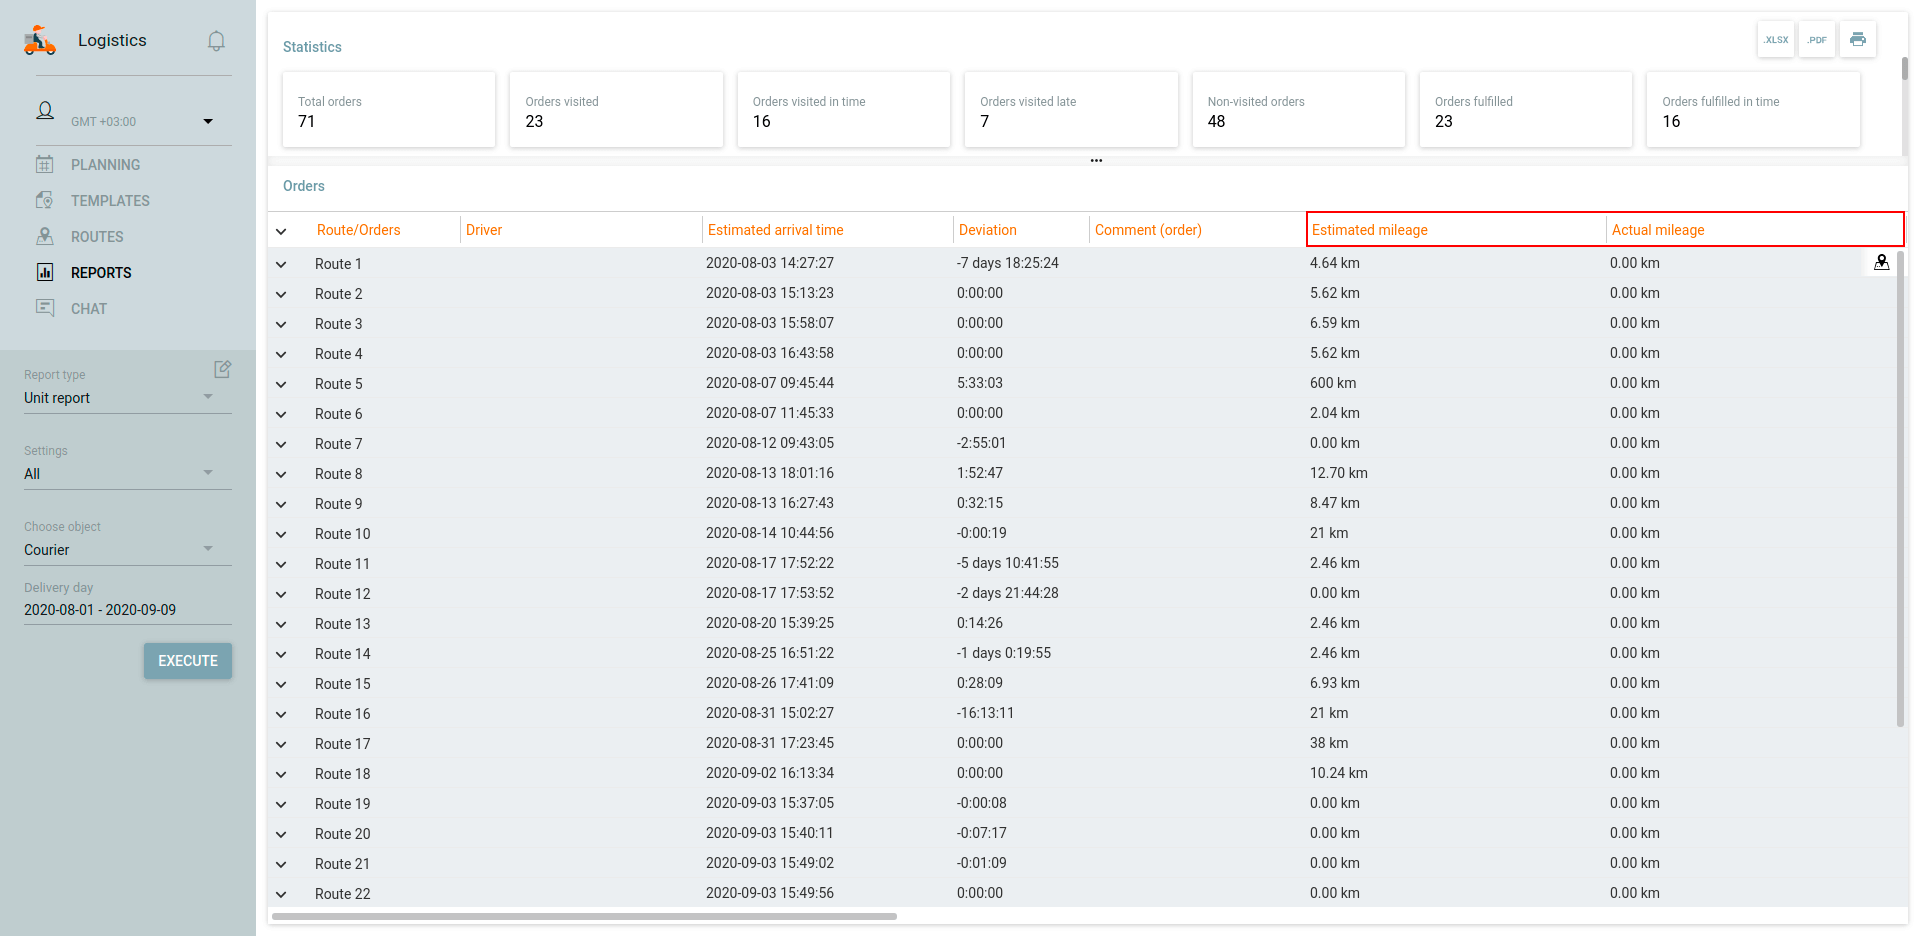
In the reports, you will find a new option for displaying the estimated and actual routes on the map. Now, when you find a discrepancy between the estimated and actual mileage in the report, you can click on the Display route button and see the route tracks on the map. More to that, when you click on the order icon on the map, you can see the detailed information about the selected order.
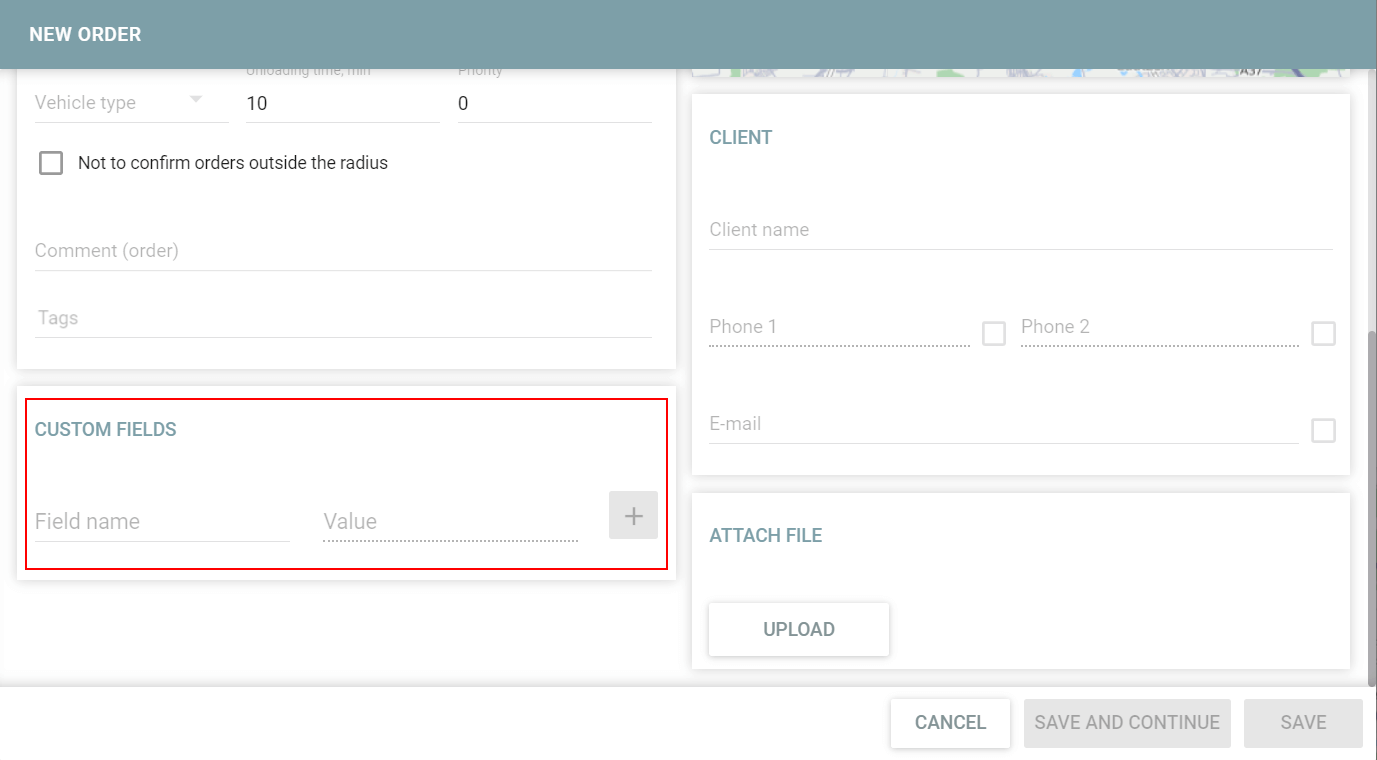
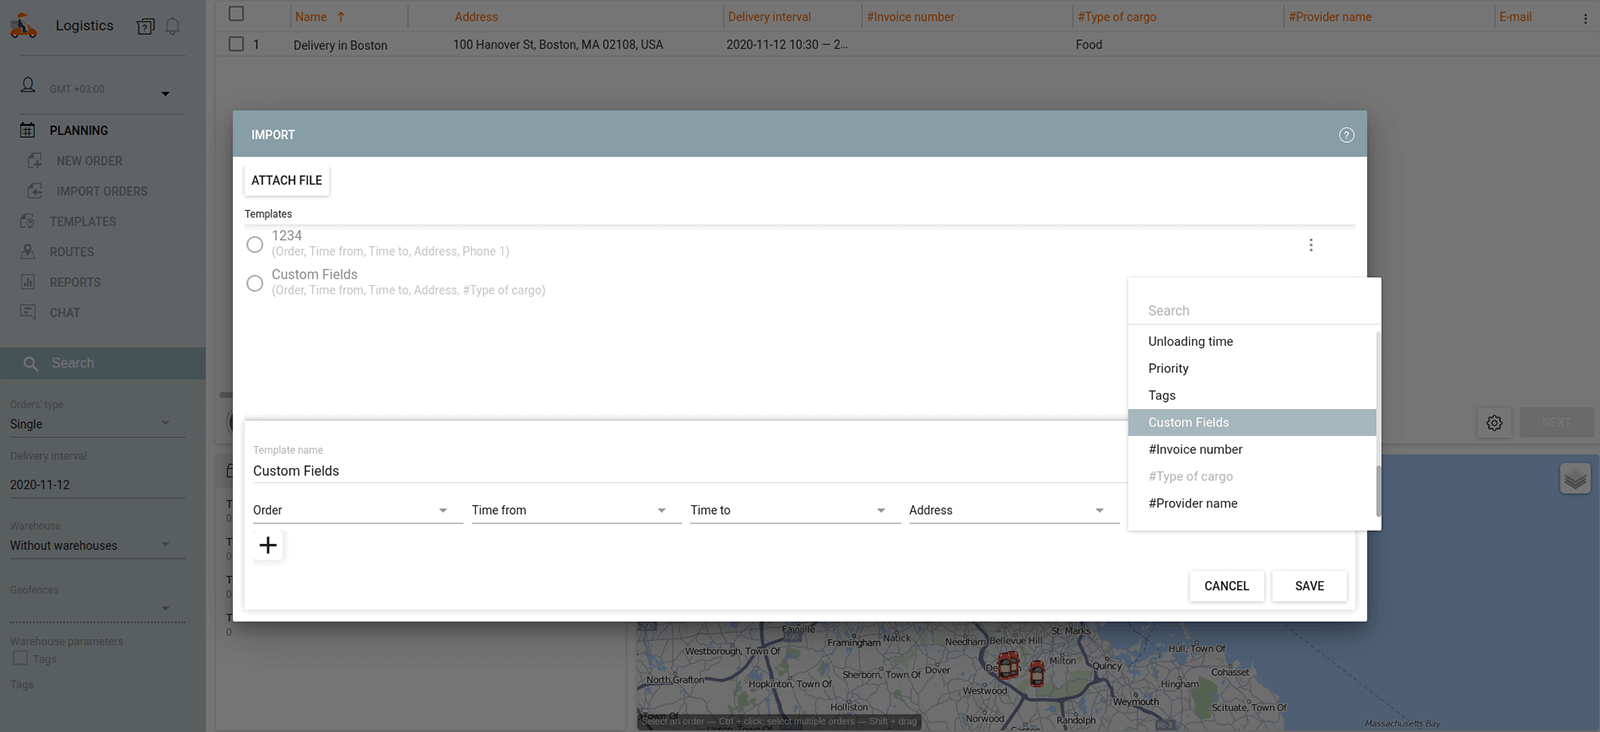
We added the ability to create custom fields with any additional info on the delivery. In the settings, there’s a new Custom fields tab where you can create as many custom fields as you need. The fields added in the settings are displayed in the separate section in the order creation dialog as well as in the orders table where each field name and its values have separate columns. It allows changing the columns order in the table and sorting info in each column.
Note: to add custom fields previously created in the resource automatically, click on the Autocomplete button.
We improved the Custom fields tab functionality. Now it’s possible to change the field sequence in the list using the Custom fields tab settings. To change the sequence, users need to drag the field into the necessary position.
Now custom fields in the order creation/modification dialog will be displayed in the same sequence as in the user settings.
We added a filter for displaying a custom field in the mobile version. In the right corner of the created field line, we placed a switcher that can be either enabled or disabled. By default, it is disabled.
If the switcher is active, then it is possible, when creating a route, to display the corresponding custom fields in all requests in the mobile app until the route gets into history.
Now the columns with custom fields are available in all types of reports. If you add the Custom fields column to the table, you will see all the custom fields added on the corresponding tab in the settings. It means that in the report, you will have all the data needed for the delivery at all times.
We have added a new map layer – OpenStreetMap. The option is available by default.
We revised the way custom fields are displayed in the order creation/editing window and also removed the ability to add them in this window. Now, you can add custom fields only in the app’s settings. It allows the user to create the field only once and get all possible related features: the field will be available in the order creation dialog, orders table, import table, reports, and will also be available in the app’s mobile version. Thus, the user can effectively manage custom fields in one place.
We have added the option to turn off the icons grouping in the General tab. Now, if the grouping is disabled, closely placed icons will not be combined into one. Thus, you can see all orders on the map without shifting.
In the Address field, you can create an order by entering the address or coordinates in the "Latitude, longitude” format. For example, if delivery is carried out to gas stations or to the places with no address (a roadside, a stop), you can specify the coordinates.
To make use of these features, please update to Wialon Local 2104.
Feel free to get the details from your personal manager or drop us a note at sales@gurtam.com to receive the latest version of the platform.
Learn more about the new version of Wialon Local 2104. Webinar recording.