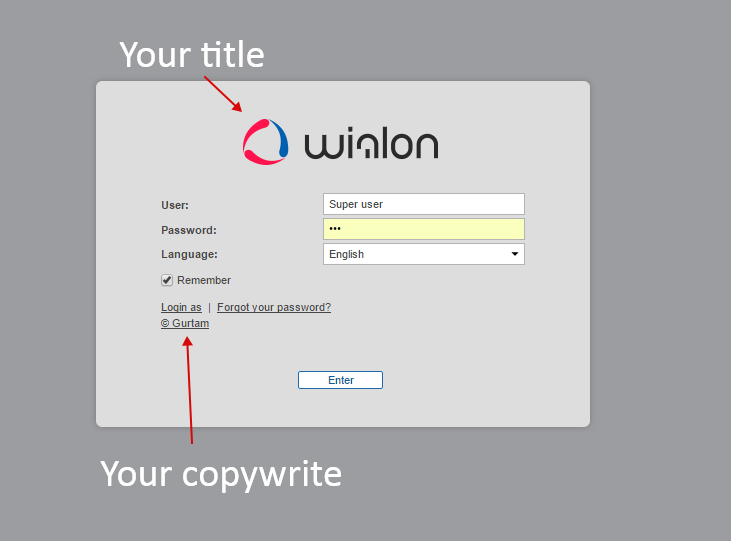
We added the opportunity of CMS Manager White label. You can personalize the login page; change the main title, a copyright and a page title. Also, we added an opportunity to log in CMS Manager through your own DNS.
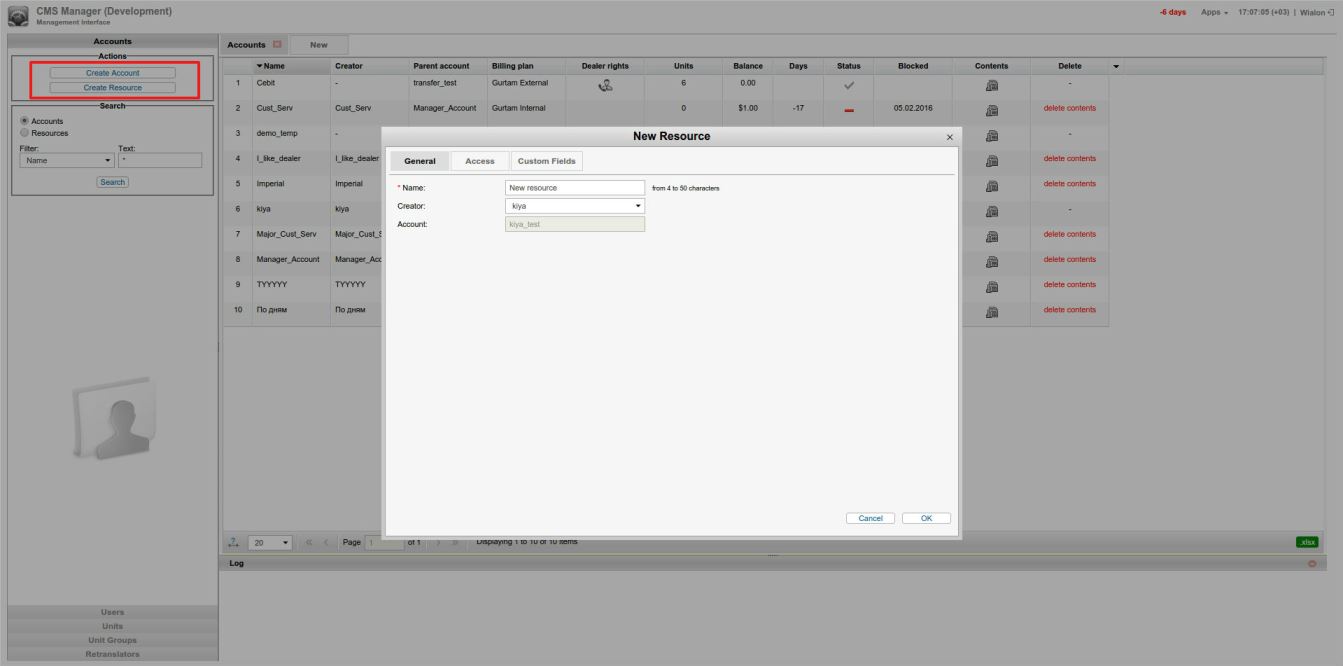
It’s now simpler to create a resource – you have specific button for this. Moreover you won’t have to master the process from scratch, as it is still carried out in the established dialog window, where you can enter its name and choose a creator from the list of available units, manage access rights or fill in custom fields. Upon this it is no more possible to create a user and a resource simultaneously and yet useless “Separate billing” flag has also disappeared from “Create Account” dialog.
Wialon Local allows users to add addresses from geofence groups and resources from a drop-down list to a report table. The report will then contain geofence name, specified by the user, instead of an address. The function will be useful for those operating in the regions with poor address data available and those not willing to guess which facility is located at one out of the hundreds of addresses.
Extended engine hours statistics with new fields: consumed in motion, avg consumption in motion, avg consumption in idle run.
Bindings table for the reports on single drivers or driver groups was supplemented by engine hours columns. Additionally we differentiate engine hours in movement and in idle run, which useful for construction fleets managers.
Moreover, when creating driver binding reports there’s now an option to add sensor masks to display information on fuel consumption. The option is useful for fuel dispensing units in case when knowledge on fuel level in tanks is not enough for effective fuel monitoring.
Human inventiveness knows no bounds. Sometimes drivers succeed in fuel thefts and cargo manipulations both during parkings and short stops. Having such knowledge we added weight columns (avg, min, max, initial, final) to reports on stops, so that dispatchers could more precisely determine the instance of fraud.
We keep on improving reports for fuel dispensers. Now when filtering intervals by units/geofences for Counter Sensors table, there appears a new column with unit/geofence name.
For more correct and convenient data visualization in counter sensors report we’ve added a new table filter – counter sensor value range. By setting minimum and maximum sensor values you will filter irrelevant values which can appear in the report table due to hardware peculiarities.
We’ve enhanced the option of sending reports by notifications or jobs triggers.
First, we put back the opportunity to send uncompressed files to email. Second, now users can send not only files/archives, but links to them. The new option will save your mailbox storage space and give an opportunity to share the link to the report with customers or colleagues.
We can’t afford to let address database deficiencies affect satellite monitoring. That’s why Wialon Local has been supplemented by the option to view the coordinates in unit tooltip and extended information. With this the users no more spend time on working with messages to get raw coordinates.
We’ve added an option to create large line geofences from tracks of real units. That way you can control routes and schedules even in geofence modules.
Saving track as a geofence is available in “Tracks” panel – just select a resource and set geofence name. That’s a great example of how the ideas of our partners promote the development of Wialon system.
We updated access rights by adding separate rights to view and edit connectivity settings (unique ID, device type, etc.) in unit properties. You can now make the information visible, but not editable. That way you preserve data transparency and stay sure that critical information won’t be edited without your consent.
New visual capabilities have become available due to the adoption of a new plugin. The first thing worth mentioning is the implementation of event markers by analogy with map markers. With the option a user won’t be distracted by the map, as he can use charts and, specifically, sensor tracing function to get all the necessary information on the unit, place and time of the event.
In the course of charts advancement we also implemented a new option to display event intervals. Trips, stops, parkings, connection loss and engine hours intervals can be used as a background for a chart or its section.
Moreover we hold open customization opportunities, including the choice of layer sequence and desired color schemes.
We are currently aimed at making chart handling more intuitive with the help of personalized colors. After modifying sensor color schemes in the previous updates we adopted the advancements for the charts. The above allows for colouring chart lines according to a color scheme of a certain sensor, i.e. binding a sensor to every line. That way you customize a chart for yourself ensuring handy presentation of information and simple data handling.
Two new parameters “Unit group” and “Driver’s phone number” were added to notification text. When a notification triggers a user knows for sure which group this unit is bound to and can easily contact the corresponding driver. This allows to check how the event affects other units in the group and prevent incidents with other vehicles.
Considering the increasing interest we are focusing on deeper integration of LBS services with Wialon system, namely with Notifications module. Notifications of geofence, address, interposition of units and connection loss types can now be triggered by LBS messages. These allows for continuous cargo tracking regardless of GPS signal performance.
Presets with an individual criteria for automobiles, trucks and buses. The criteria are based on the objective data from dozens of real vehicles and, therefore, can be applied in practice. Nevertheless, each criterion can be readjusted to a particular task, project or vehicle.
We added “Rating by violations” to Eco Driving report for driver and unit groups with color marking which makes driver ranking within the group more intuitive. If the driver is marked red, assume supervision over his operations. Green marking is another reason to reward him.
Reports on passengers with the option to display geofence name as an address.
“Passenger activity” notification is intended for parents and created separately for each passenger to signify entering or leaving the bus. Thus parents are automatically informed that the child has got to school.
“Passenger alert” notification is intended for school employees/drivers and triggers whenever a passenger is left in a bus. After the notification is received a teacher can contact a pupil or a driver to check the bus again.
Core information on each passenger, including the last event (pick-up/drop-off location; “unknown”), available in tooltip.
Automatic unbinding 10 hours after passenger pick-up. If this happens, you can see “automatic unbinding” mark in passenger history.
Sensor properties dialog underwent major transformation. “Wizard”, “Calculation Chart” were merged with “Calculation table” to from a universal tab where you can fill in calculation table, use calculation table wizard to generate a table from known XY pairs and view the corresponding charts based on table values in one click due to quick switch to chart mode.
The Locator dialog has become larger, and links are generated in a separate window now. You can look at the list of units assigned to a link with no need to open editing dialog. Also, we’ve added tooltips to all Locator icons so that new users can learn the tool faster.
Now the orders can be imported to the system both in .csv and .xlsx format which simplifies the import procedure and makes it flexible. After the import, you can easily make any changes in the table of orders.
The updated Logistics allows for more flexible work with orders. Now you can mark them with custom tags and then sort by given properties (e.g. by product category). Being marked with identical tags, orders can be bound to a definite warehouse, which ensures prompt search for the needed orders to distribute further.
New flexible filters you can use for prompt order selection:
We’ve added an option to compare estimated (bold line) and actual (thin line) routes in real-time mode. The new feature allows a dispatcher to check courier performance.
The notification system has been significantly improved, this time for a courier fulfilling a delivery. We supported 9 notification types:
The implemented drag&drop feature in report tables generation allows for simple customization.
Secure backup files from becoming “dead” due to limited storage period in the system with Backup Viewer. The app allows you to view archive messages and unit tracks, visualize the latter on the map and review message data upon pointing on a track. Enjoy minimalistic and user-friendly interface, ample filtering opportunities and customizable tables to work faster.
When standard movement detection methods (by speed) fail due to hardware errors or LBS-service utilization, we suggest you to use real-time motion sensor. The sensor is digital by nature and allows you to create calculation table and set speed, ignition, rpm and other indices as sensor parameters. Moreover, the use of formulas in sensor parameters allow for adequate validation (e.g. if the speed is above 3 km/h, the unit is moving, but only when the ignition is on).
Now you a have chance to run test execution of a job in Wialon. The one-time job execution doesn’t affect its schedule and helps you check the expected result (for instance, if a proper report was created and sent to your e-mail). Thus, when the result is critical, you may be sure that nothing will go wrong.
We also augmented “Profile” tab with the option to edit drop-down lists by adding, modifying and deleting irrelevant items. Thus, we get a reference book allowing a user to save time on vehicle description and automate the process.