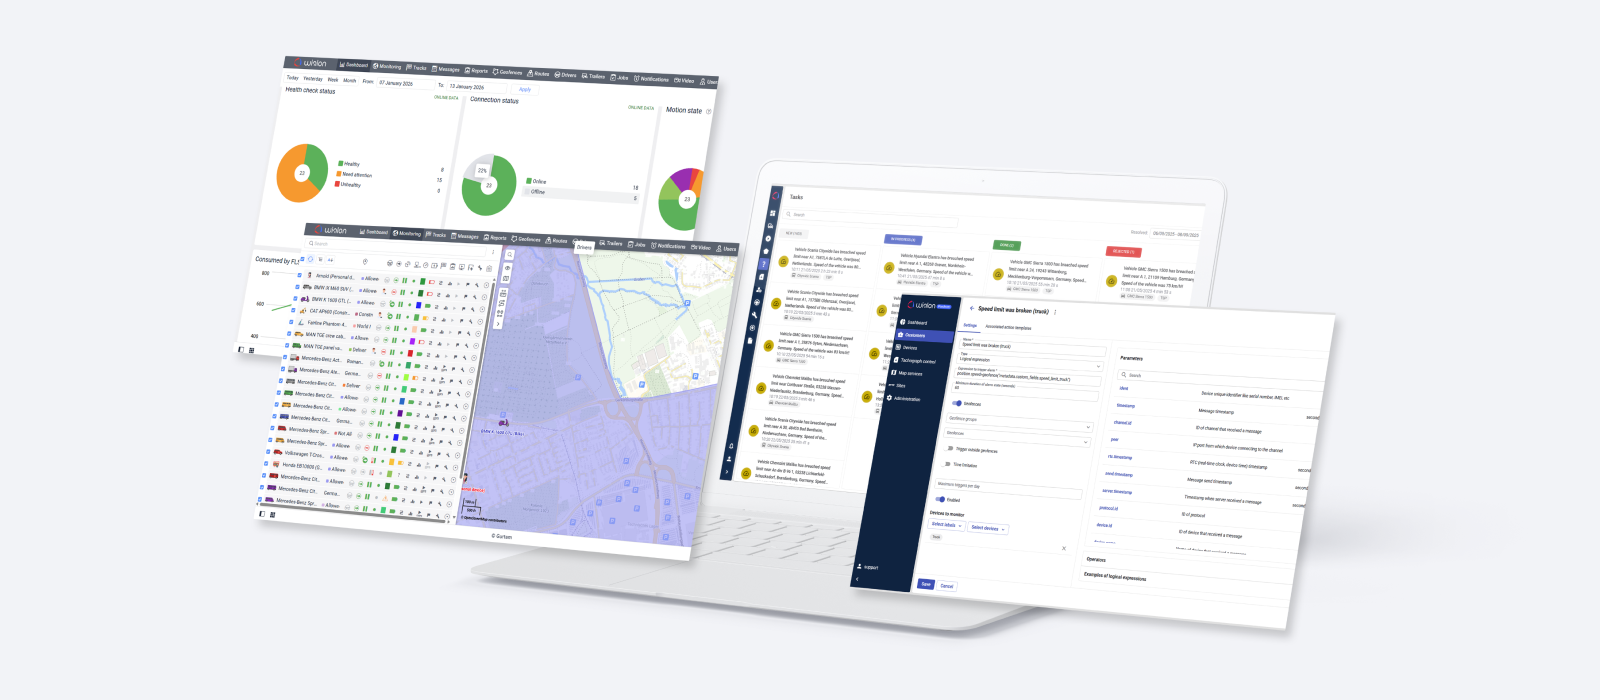
Be prepared. This month the novelties are numerous and all-important. So why don’t we proceed with the long-read without further ado? Check the article for important info on the reports, notifications, event markers, and CMS Manager. This year, these are the last functions to become a part of Wialon Local 1804.
CMS Dashboard
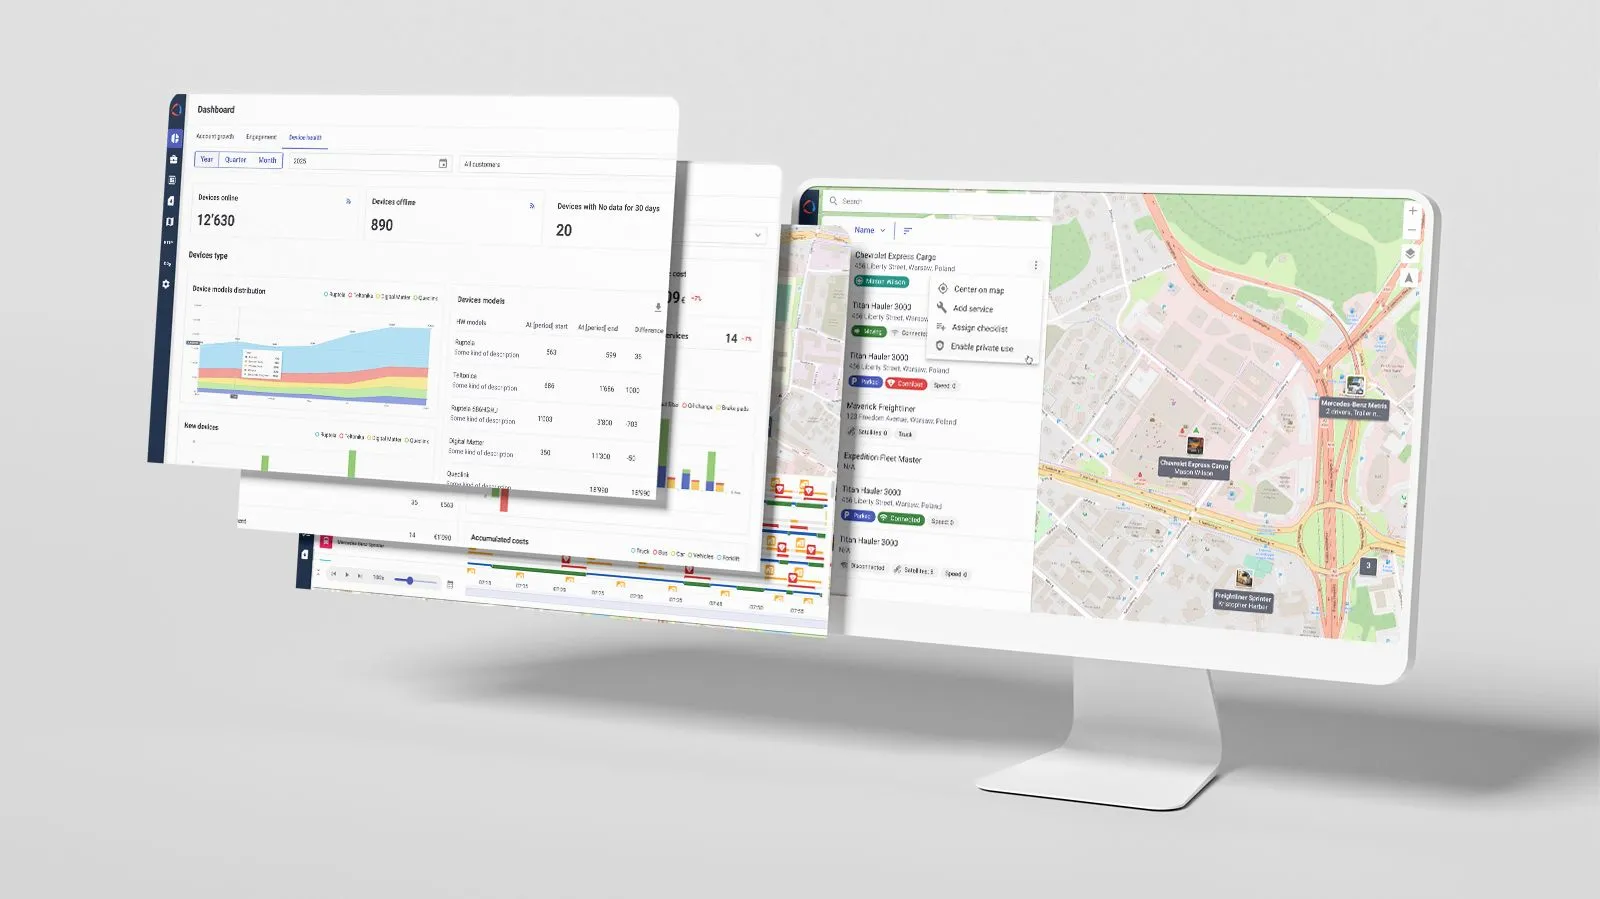
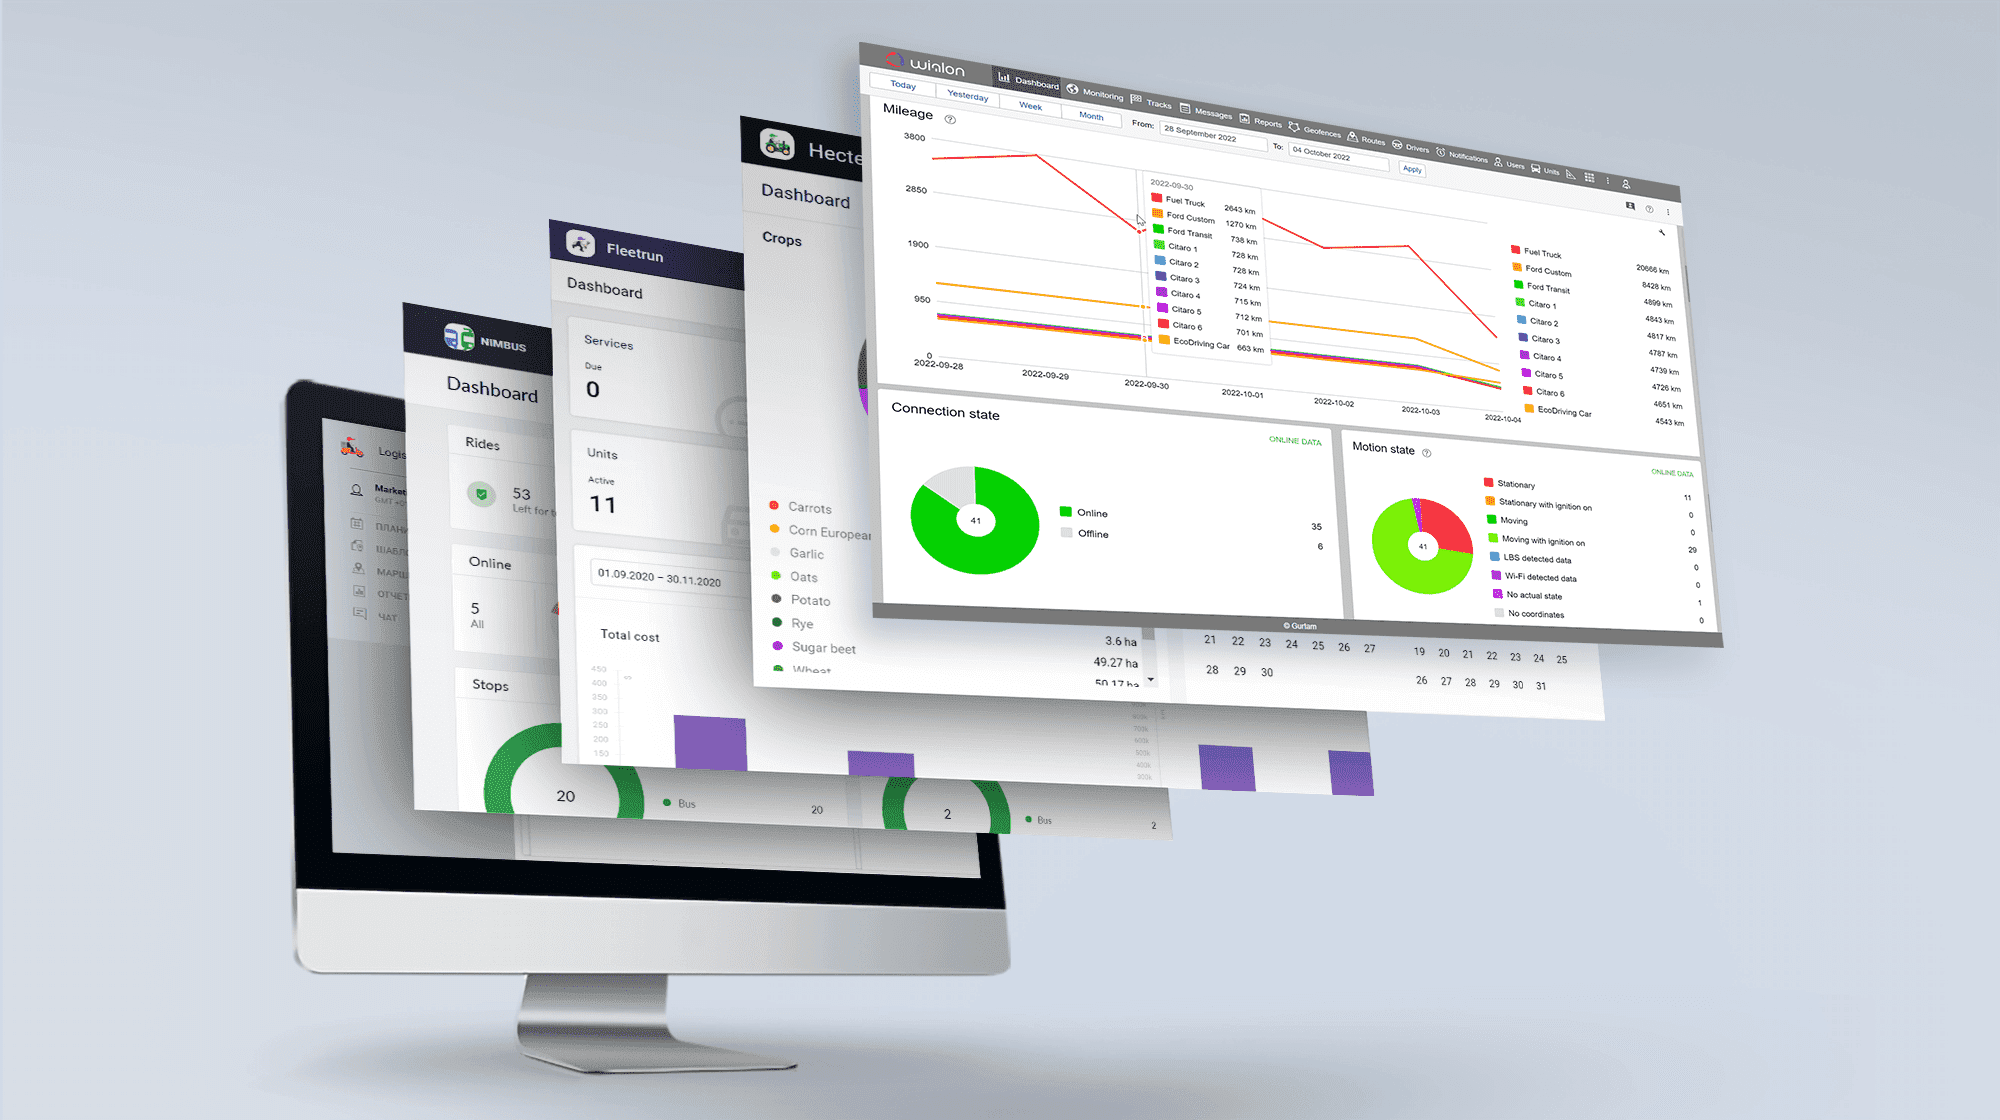
Most Wialon users associate Dashboard with a web-app for data analysis and visualization as charts and diagrams. Just recently, we’ve implemented the same tool for NimBus and Logistics to display the summary of how users operate the web services.
After mastering Dashboard on our flagship solutions, we implemented the tool in CMS Manager.
Dashboard for Wialon management system is designed for all users. You start with 4 sections containing pre-set charts or statistics. Further configuration is flexible – change the time interval, chart type, detalization, the number of sections in the work area and the account. Consolidated information is available for the following elements and processes:
- units, users, resources, routes, geofences, jobs, notifications, drivers, trailers, and sensors;
- changes in hardware structure – new/deleted units with a certain type of devices or switch to another equipment;
- SMS usage;
- user logins.
Try the option in the developers thread.
Why using it?
Figures and charts show fleet managers how the system is implemented at every hierarchical level. The whole picture is full-frontal – you no more need to get through reports or collect the data manually.
Redesigned reports
Take a closer look at the Wialon reports module. We offer 300+ monitoring parameters to report on and 120+ statistics items, multi-level grouping, sensor mask bindings, and dozens of extra options.
Today we make powerful analytics simpler by grouping settings, structuring reports, and dividing contents into tabs. Same functionality – better usability. Let’s have a closer look at the core novelties.
Template creation
As you always do, select a resource, enter report name and type. Now you can see a renovated template dialog where you can navigate between five tabs:
- “Contents” shows added report tables and charts;
- “Settings” contains general options for the whole template;
- “Bindings” allows assigning a unit to the report for quick execution.
Use two more tabs below to add tables and charts – a single dialog for everything.
Why using it?
- As in the browser, switching between tabs is quicker than opening new window/dialog time and again;
- The tabs are associated with steps: add tables and charts – configure the template – bind a unit. This contributes to the intuitive navigation.
Tables and configuration
Add tables, charts and selects parameters as you used to. The novelties are ahead:
- new button to create “Statistics” report table;
- separate tabs to change columns orders and configure the table.
First, we’ve structured the settings and divided them into three blocks: “Groupings”, “Parameters”, “Filters”. Each can be minimized, and grouping types are added one by one thus saving space to display more elements.
Why using it?
Settings are no more rattling around somewhere aside. All the necessary information is displayed on the separate tab. Thus, it’s better perceived and understood for you to configure every aspect in details.
Calculator in reports
Good news, you can delete the calculator app from the home screen of your smartphone. Gurtam offers a better way to handle figures in the report. When working with table contents you can add, subtract, divide, and multiply any numeric values with the calculator embedded in Wialon. That’s how it works:
- Select table columns to be displayed in a report. Every column receives an index (i.e. C1,C2...Cn), just like in Excel.
- Enter an arithmetic formula for the “Calculator” in the corresponding field. Use the indices above (C1-Cn), math operations (“+”, “-”, “/”, “*”), priorities “()”, constants, and specific parameters, like “Consumption by rates” (rcoef), “Daily engine hours rate” (dehr), and “Mileage coefficient” (mcoef).
- Set a unit of measurements (e.g. kg, dollar)
As a result, you get a separate column with calculated values. See the typical formula in the screenshot below.
Why using it?
- Multiply the volume of fuel spent by the constant cost per liter to calculate fuel expenses;
- Multiply mileage in trips by the price per mile to report on the cost of taxi service;
- Learn more about carbon emission by using coefficients for mileage and fuel consumption.
If you can calculate any value with more precision than Wialon does – give it a try.
Street View for event markers
In the evenings, my father was peering out the kitchen window just to check if everything is OK with his clunker “Ford” for 1,500 dollars. I reckon that the owners of Scania trucks costing $ 100,000 must be worrying 66.7 times more. Although fleet managers often can’t see parked trucks through the window, they can do it on panoramas by Google and Yandex. In the update, we simplified the task. Just click on “Stops” and ”Parkings” markers in tracks and reports to quickly see the locations on the map with your own eyes. Unlike my father, you won't see your trucks on the panoramas in real time. But at least you'll find out if a driver leaves the vehicle on a guarded parking or somewhere across the street.
Why using it?
- Quickly evaluate the situation on the parking site, where the truck stays at night (fencing, security cameras, illumination, etc.);
- Study the location of unauthorized stop – there may be a gas station to cover up fuel card frauds.
Knowing about the fraud schemes taking place only when the vehicle is not moving, you can get quick access to the panoramic view in the corresponding locations.
Filter by geofences in notifications
Remember “The Boy Who Cried Wolf” story? The same applies to notifications – if the information messages are too many, you stop reacting to them with full responsibility. For you to concentrate on the important things we added a special filter by geofences/geofence groups in “Connection loss” and “Idling” notifications.
Why using it?
- If you need to receive “Connection loss” messages only when it’s determined by the hardware malfunction, there’s a solution. Just create geofences for tunnels, warehouses, and parking garages, set those as filters in notification settings and get rid of useless information.
- The same is applicable if you need “Idling” notifications to trigger only outside the warehouse.
Try the new functions, leave comments on our forum and pay special attention to reports. Today we presented the new functionality and design, while the next article will focus on design. Subscribe to blog updates and never miss a story from Gurtam!
