Last month, we updated three products, and here is a short digest for you. Let’s see what features were improved and added.
Wialon Hosting
We enhanced the driver and trailer manual binding dialog
Now, you can view the binding history, register shifts, and delete extra points in just one dialog. Click the “Register working interval” button against the needed driver and manage their shifts and bindings over any interval in the updated dialog.
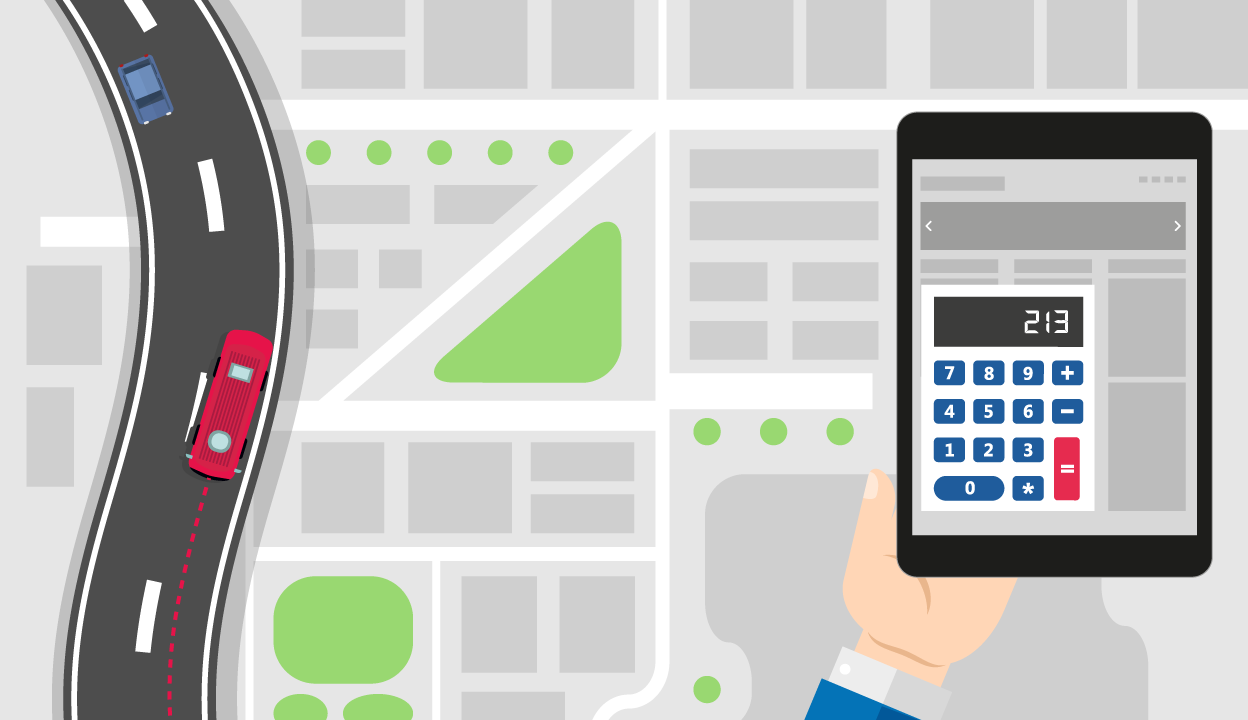
We added the calculator to all reports
A small reminder: numeric values in the table cells can be added, subtracted, divided, and multiplied – the result is displayed in a new column.
What has changed: when working with the tables, activate the new option by clicking on the “Add calculator” button, select the columns and calculation formula.
Where: the option is available in all reports tables.
WiaTag
Visit wiatag.com
There you can generate a QR-code and use it for a quick login to WiaTag. Now, while creating QR, you can set the admin password or turn on the app remote control.
Admin password protects WiaTag configuration. If you set this password while generating a QR-code, an employee will be able to login to WiaTag, work there but won’t be able to change settings: for example, to switch from the “Active” mode to the “Lite” mode and thus reduce the tracking accuracy.
Remote control gives you access to WiaTag settings on the smartphone of the person who has scanned the QR-code. As a result, you don’t limit the user when they work with the app, but at the same time, you can change the settings if there is a need to do so.
Besides, if the QR-code is saved in the phone’s gallery, you can send it multiple times and don’t have to create a new one over and over again.
Widgets
Android version of WiaTag got widgets for turning the service on/off, sending SOS-messages, photo, location, and QR-code data. Being in danger, you can send an SOS-message directly from the smartphone home screen without the need to login to the app.
NimBus
Detailed visualization of the fulfilled ride on the map
Now, you can go to the map right from the report on the routes and view the unit’s detailed track.
For example, according to the report, the bus visited 8 stops out of 10 and was 13 minutes late for one of them. Let’s clear this up. We click on the “See on the map” button...
...get to the route and see two stops marked with white color. They are the ones the driver missed. Then we zoom the map and see the unit’s track on top of the route showing how the bus was moving and where it went off the route.
Hovering over any track point, we will learn the unit’s speed in this point and the time when the unit was in this point.
Hovering over the stopping point, we will see a tooltip with:
its name;
scheduled time of arrival;
actual time of arrival;
delay or advance in the schedule.
This is an excellent functionality when you want to see something more visually compelling in the report than just figures and letters.
That’s it for the latest enhancements. But we keep on developing Wialon and apps. Test new functions and leave your comments on our forum.
